
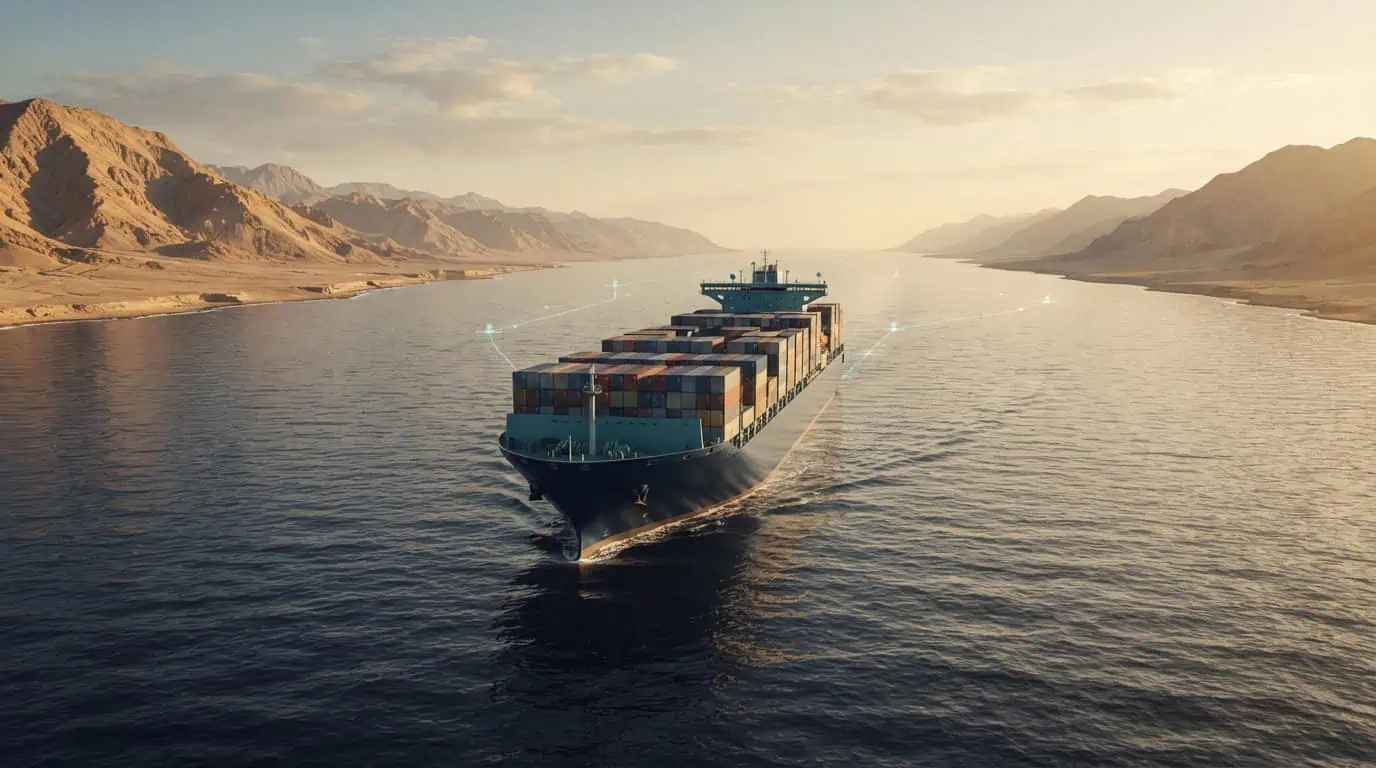
If you booked ocean freight any time in the last two years, you already know the short version: the Red Sea got dangerous, ships stopped using it, and everyone’s cargo started taking the long way around Africa. That much is old news.
What’s less settled and far more useful to understand right now is what happens next. Carriers are testing the water again. Literally. Some strings are back on Suez. Others aren’t going anywhere near it. Rates are behaving in ways that don’t match textbook supply and demand. And nobody in the industry is willing to call it a “recovery” without a giant asterisk.
This guide breaks down where Red Sea shipping actually stands today, the scenarios that could play out over the next 12–24 months, and most importantly what it means for how you plan cargo routes, budgets, and contracts.
Note: Shipping conditions in this region change week to week. The figures below reflect the most recent industry reporting available at the time of writing. Always confirm current transit and security data with your carrier or a Red Sea intelligence service (Lloyd’s List, JMIC, Drewry) before making routing decisions.
Why Red Sea Shipping Broke in the First Place
A quick refresher, because the “why” shapes the “what’s next.”
Starting in late 2023, Houthi forces based in Yemen began attacking commercial vessels transiting the Bab el-Mandeb Strait the narrow chokepoint connecting the Red Sea to the Gulf of Aden. The stated target was ships linked to Israel, but the attacks quickly widened to hit vessels with no connection to the conflict at all.
Container lines didn’t wait to find out if their ships were “safe enough.” Within weeks, most major carriers Maersk, MSC, CMA CGM, Hapag-Lloyd, COSCO, and others pulled their Asia-Europe strings off the Suez Canal entirely and rerouted around the Cape of Good Hope.
That single decision reshaped global shipping for two straight years.
The scale of the diversion
- The Cape of Good Hope route adds roughly 3,000–3,500 nautical miles and 10–14 extra days to a typical Asia–North Europe voyage compared with Suez.
- At the low point, Suez Canal container traffic ran as much as 60% below pre-crisis levels.
- A longer loop means more ships are needed to maintain the same weekly sailing frequency — analysts estimate the Cape diversion has absorbed somewhere around 10–15% of effective global container fleet capacity, which is a big reason rates didn’t collapse the way raw overcapacity numbers suggested they should.
Expert tip: If you’re explaining this to a stakeholder who isn’t in logistics, the fleet-capacity point is the one that lands. It’s not just “ships are late” it’s “the industry is quietly running with fewer available ships than the numbers show,” because so many are stuck on longer loops.
Where Red Sea Shipping Stands Right Now
This is the part that catches people off guard: Red Sea shipping isn’t fully broken anymore, but it isn’t fixed either. It’s in a messy, carrier-by-carrier, service-by-service middle state and that middle state is likely to last a while.
What the data shows
Suez Canal traffic rose in August 2026 compared with the same month the previous year, as major container lines gradually increased their use of the Red Sea route between Asia and Europe. The Suez Canal Authority recorded 1,358 vessel transits in August, generating $567.1 million in revenue up from 1,070 vessels and $326 million a year earlier
Container ship traffic through the canal reached 72.1 million net tons over the first eight months of 2026, with major carriers including CMA CGM, Maersk, MSC, Hapag-Lloyd, and COSCO resuming use of the canal to varying degrees though not all ocean carriers have returned. Premier Alliance members ONE, HMM, and Yang Ming, along with Evergreen, remain the primary lines still avoiding the Red Sea route entirely.
Carriers have been shifting more capacity back through Suez on the backhaul (Europe to Asia) than on the headhaul, with the share routed through Suez rising from 18–26% in August to 25–47% in September. That’s a telling detail lines are prioritizing getting empty or lightly loaded ships back to Asia quickly, partly because record port congestion in East Asia has tied up an estimated 4.3 million TEUs of vessel capacity.
Weekly Suez Canal transits reached levels not seen since early 2024, driven partly by renewed Red Sea traffic and the rerouting of Saudi-bound cargo northbound. Bulk carriers, containerships, tankers, and vehicle carriers are all posting year-on-year gains. Still, northern Red Sea chokepoint transits remain about 36% below normal levels, even though they’re running roughly 30% higher than the same period in 2025.
The honest summary
| Metric | Status (2026) |
| Suez traffic vs. pre-crisis levels | Still well below normal recovering, not recovered |
| Major carriers back on some Suez routes | Maersk, Hapag-Lloyd (Gemini), MSC, CMA CGM, COSCO |
| Carriers still avoiding Red Sea entirely | Evergreen, ONE, HMM, Yang Ming |
| Direction favoring Suez return | Europe → Asia backhaul, faster than Asia → Europe headhaul |
| Security risk assessment | Reduced intensity, but not eliminated insurers still flag it as high-risk |
The theme across nearly every industry report: this is a partial, conditional, and reversible return not a reset to how things worked before 2024.
The Two Routes, Side by Side
Understanding the physical and financial trade-off between the two options is the foundation for everything else in this article.
| Factor | Suez Canal Route | Cape of Good Hope Route |
| Asia–North Europe transit time | ~30–35 days | ~42–48 days |
| Extra distance vs. Suez | — | ~3,000–3,500 nautical miles |
| Ships needed per weekly string | ~9–11 | ~11–13 |
| Canal transit fees | Payable (often 400,000–500,000+ per large containership) | None |
| Fuel consumption | Baseline | Higher, especially when speed is increased to protect schedules |
| War-risk insurance premiums | Elevated, security-dependent | Lower |
| Schedule reliability exposure | Vulnerable to Bab el-Mandeb security incidents | More stable, but exposed to Cape storms and piracy risk off West Africa |
Common mistake: Assuming the Cape route is automatically the “safe, cheap” default. It isn’t cheap it’s expensive in fuel and tonnage-days, just expensive in a different, more predictable way than Suez security risk. Carriers choose it because the cost is known, not because it’s low-cost.
What Could Change: Four Scenarios for the Next 12–24 Months
No one can tell you with certainty which of these plays out but understanding the range helps you build a routing strategy that isn’t blindsided by any single one.
1. Gradual, uneven normalization (most likely near-term path)
This is the pattern currently unfolding: carriers add back services one string at a time, watch security data closely, and keep a Cape-routing option ready to reactivate on short notice.On 14 September 2026, the Gemini Cooperation (Maersk and Hapag-Lloyd) issued a customer advisory moving four more named services and vessels off the Cape of Good Hope and back through the canal, with specific sailing dates published in advance.
Under this scenario, expect:
- Continued creeping increases in Suez transit share, but plateauing well below 2023 levels for a long stretch.
- Different carriers move at different speeds based on their own risk tolerance and alliance commitments.
- Freight rates softening gradually rather than collapsing, since full fleet capacity doesn’t return to the market all at once.
2. Full-scale return
If Red Sea security conditions stabilize durably and war-risk insurers meaningfully cut premiums, carriers could accelerate their return, releasing a large chunk of absorbed fleet capacity back into the market at once.
Industry estimates suggest a broad return to the canal would release somewhere in the range of 2–6% of global container fleet capacity back into an already well-supplied market which is exactly why some carriers are cautious about this scenario rather than racing toward it. A sudden mass return risks:
- A sharp drop in freight rates industry-wide.
- Port congestion in Europe, as Suez-routed ships arrive at the same time as vessels still finishing longer Cape voyages, compressing arrivals into a shorter window.
3. Renewed escalation
Houthi attacks or a broader regional conflict flare-up could reverse the current gains overnight. This isn’t a hypothetical renewed Houthi threats were reported even as the broader Suez recovery continued through August 2026, without derailing it. But the sector’s own language describing the situation as “normalized risk” rather than “resolved risk” reflects how quickly that could change.
4. Permanent bifurcation
A real possibility worth planning for: the industry doesn’t fully return to Suez or fully abandon it, but instead settles into a permanent dual-network model, where:
- Time-sensitive, high-value cargo goes via Suez when conditions allow.
- Cost-sensitive, less time-critical cargo defaults to Cape routing as standard practice, insurance and fuel costs baked into pricing permanently.
What’s Driving Carriers Back to the Red Sea
It’s not optimism. It’s an economic and operational necessity.
- Fuel and tonnage costs. Every extra day at sea burns fuel and ties up a vessel that could otherwise be earning revenue elsewhere.
- Fleet efficiency. Shorter loops mean fewer ships are needed to run the same weekly service, freeing up capacity that’s been effectively “trapped” on long Cape rotations.
- Congestion relief. Carriers are prioritizing the return of vessel capacity to Asia specifically because of severe, ongoing port congestion across East Asian hubs Suez offers the fastest path back to reposition ships.
- Toll discounts. The Suez Canal Authority has a track record of adjusting transit fee discounts to make the canal more competitive against the Cape alternative during periods of reduced traffic.
- Regional cargo shifts. Rerouting of Saudi-bound traffic northbound has added extra momentum to Suez transit numbers, independent of the container-line decision-making.
What’s Keeping Other Carriers Away
- Insurance won’t budge easily. Insurers continue to classify the region as high-risk, meaning the added cost isn’t going away just because attack frequency has dropped the risk has normalized into pricing and operations rather than disappeared.
- Reputational and crew-safety exposure. No carrier wants to be the one whose vessel makes headlines after a decision to return early.
- Alliance-level caution. Lines operating in cooperative networks (like Premier Alliance) may hold back collectively even if individual member appetite varies.
- Schedule reliability trumps speed. A slower but predictable Cape rotation can beat a faster but potentially disrupted Suez rotation for contract-bound service commitments.
Impact on Global Cargo Routes and Supply Chains
The Red Sea situation isn’t an isolated shipping-lane story it’s reshaping global cargo routes and international cargo shipping economics more broadly.
Freight rates
The Drewry World Container Index recorded the Shanghai–Genoa lane down 5% and Shanghai–Rotterdam down 4% in the week to 24 September 2026, with the Freightos Baltic Index showing similar declines in mid-September early signs that increased Suez capacity is starting to soften rates on Asia-Europe lanes specifically.
Expert tip: Watch the gap between headline index rates and what actually lands on your invoice. Bunker adjustment factors (BAF) and Red Sea-related surcharges often get added separately, so a “falling rate” headline doesn’t automatically mean your all-in cost is falling at the same pace.
Port congestion patterns
When carriers taking the faster Suez route arrive in Europe at the same time as vessels that took the longer Cape route, it can cause serious port congestion for several weeks</cite> a scheduling collision that’s a direct byproduct of the industry’s uneven, phased return.
Regional winners and losers
- Gulf ports dependent on Red Sea transit traffic have been squeezed by the prolonged diversion and remain geographically “trapped” by the situation their fortunes hinge heavily on how long the navigational restrictions persist.
- Southern African ports (South Africa, in particular) saw a temporary boost in bunkering and transshipment activity from the Cape diversion a boost that will likely fade if Suez traffic keeps recovering.
- Mediterranean-origin services are seeing the fastest return to Suez, since 57% of Mediterranean-Asia capacity was expected to transit the Red Sea in September 2026, compared with just 27% of capacity from North Europe geography makes the Suez detour relatively more costly for northern European origins.
Pros and Cons: Suez Return vs. Continued Cape Routing
Pros of a fuller Suez return
- Shorter transit times, better on-time delivery performance
- Lower fuel burn per voyage
- Frees up fleet capacity industry-wide, which can ease rate pressure over time
- Reduces strain on crews from extended voyages
Cons of a fuller Suez return
- Reintroduces direct security exposure to attack risk
- Elevated war-risk insurance costs that don’t disappear quickly
- Risk of rate volatility and port congestion if the return happens too fast
- Reputational risk for carriers if an incident occurs after a public return announcement
Pros of continued Cape routing
- Predictable, security-risk-free operating environment
- No canal transit fees
- Easier scheduling and contract reliability for now-established Cape rotations
Cons of continued Cape routing
- Higher fuel costs and longer transit times, permanently
- Ties up more vessels per service, propping up freight rates
- Extended lead times strain inventory planning and working capital for shippers
What This Means for Shippers: Practical Guidance
If you’re responsible for moving cargo whether you’re a freight forwarder, an importer, or a supply chain manager here’s how to actually use this information.
Build routing flexibility into contracts
Don’t lock into rigid transit-time assumptions. Ask your carrier or forwarder directly which route each specific service is currently using, since it now varies string by string, not carrier by carrier.
Separate cargo by urgency
Following the same logic carriers themselves are using:
- Route time-sensitive, high-value goods through carriers still actively using Suez when security conditions support it.
- Accept longer lead times for cost-sensitive, non-urgent freight and plan inventory buffers accordingly.
Rebuild your buffer-inventory assumptions
Two years of extended transit times have pushed many companies toward higher safety stock. Before scaling that back down, confirm your specific trade lane has stabilized not just that headlines say “Suez is reopening.”
Watch insurance and surcharge line items closely
War-risk premiums and Red Sea-related surcharges can appear and disappear from quotes with little warning. Ask your forwarder to itemize these rather than accepting a blended all-in rate, so you can track when and if they actually go away.
Diversify carrier relationships
Given the split between carriers returning to Suez and carriers staying on Cape routing, working with more than one carrier or alliance gives you optionality if one network gets disrupted.
Common mistake: Treating “the Red Sea crisis” as a single binary event that’s either “on” or “off.” It’s not it’s a spectrum of carrier-by-carrier, service-by-service decisions that shift weekly. Planning around a single headline instead of your specific trade lane’s current routing is one of the most common and costly mistakes shippers make right now.
Frequently Asked Questions
Is it safe to ship through the Red Sea in 2026?
Risk has declined significantly from the peak of the crisis, but it hasn’t disappeared. Insurance companies continue to classify the region as high-risk, and carriers are treating security conditions as something to be continuously monitored rather than a resolved issue. Whether it’s “safe enough” for your cargo depends on your carrier’s current routing, your cargo’s value, and your risk tolerance.
Will Red Sea shipping fully return to normal?
Not in the near term, based on current trends. Multiple carriers remain off the route entirely, and even the lines that have returned describe their moves as conditional and reversible. A full return to pre-2024 traffic levels would require sustained security stability over a much longer period than has been observed so far.
Why are some carriers back on the Suez Canal while others aren’t?
It comes down to differing risk tolerance, alliance strategy, and network design. Carriers like Maersk, Hapag-Lloyd, MSC, CMA CGM, and COSCO have resumed partial Suez use, while ONE, HMM, Yang Ming, and Evergreen have not. There’s no universal industry consensus yet.
How much longer does the Cape of Good Hope route take?
Typically 10–14 extra days and roughly 3,000–3,500 additional nautical miles compared with the Suez Canal, on an Asia–North Europe voyage. The exact figure varies by origin and destination port pair.
What happens to freight rates if all carriers return to the Red Sea?
Rates would likely face significant downward pressure, since a full return releases fleet capacity currently absorbed by longer Cape rotations back into the market potentially creating oversupply relative to demand. However, most analysts expect this to happen gradually rather than all at once, which would soften not eliminate the price impact.
Should I still plan for Cape of Good Hope transit times?
For now, yes especially for non-urgent cargo or lanes served by carriers that haven’t returned to Suez. Build in the longer lead time as your default assumption, and treat any Suez-route savings as an upside rather than a guarantee.
How can I track current Red Sea shipping conditions?
Follow direct, primary sources rather than relying on general news headlines: Suez Canal Authority statistics, Lloyd’s List Intelligence’s Red Sea Briefs, Drewry’s Red Sea Diversion Tracker, and advisories from your own ocean carriers or freight forwarder.
Conclusion: Key Takeaways for Planning Ahead
The future of Red Sea shipping isn’t a single event you can wait out it’s an ongoing, carrier-by-carrier recalibration that will likely define global cargo routes for years, not months.
Actionable takeaways:
- Don’t assume uniformity. Check the actual route your specific carrier and service are using it varies string by string in 2026, not company-wide.
- Plan for the dual-network reality. Whether or not attacks resume, a permanent split between Suez-first and Cape-first networks looks increasingly likely to be the industry’s long-term structure.
- Keep contracts flexible. Build routing and lead-time flexibility into freight contracts rather than locking in assumptions based on pre-2024 or peak-crisis transit times.
- Track surcharges separately from base rates. War-risk premiums and Red Sea surcharges are the line items most likely to shift as conditions change.
- Revisit your strategy quarterly, not annually. Given how fast conditions have moved through 2026, a routing and risk strategy set once a year will be out of date before it’s even finished being implemented.
The ships that make the “right” call on Red Sea routing over the next two years won’t be the fastest or the cheapest; they’ll be the ones built to adapt as the picture keeps changing.